Bottling losses in breweries: overfilling, the loss no one sees
Overfilling, tank bottoms, purges: where does your beer go? Using a demonstration scenario, Valentin Kaulmann shows how to use existing data to break down losses by line, valve and crew, then identify concrete actions.
By Valentin Kaulmann, Analytics Project Engineer at Indao, brewing process specialist - September 2026.
In an industrial brewery, a few percent of the finished beer never makes it into a saleable bottle. And a significant share of these losses does not come from rejects: it leaves the brewery, a few millilitres at a time, in bottles that fully meet specifications.
Here is how to break down those losses by cause, line, valve and crew, using the data your line already produces.
Beer lost during packaging is the most expensive beer in the brewery
Between the outlet of the bright beer tanks - BBTs - and the finished pallet, the beer has already been brewed, fermented and filtered. Its full production cost has been incurred.
The finance team generally knows the overall loss figure at the end of the month. What is missing is the breakdown: where the beer goes, at each stage, and why. Without that breakdown, no one manages beer losses. They simply record them.
To illustrate the approach, consider a demonstration brewery with two bottling lines:
-
L1: 40,000 bottles per hour, with 60 filling valves.
-
L2: 30,000 bottles per hour, with 48 filling valves.
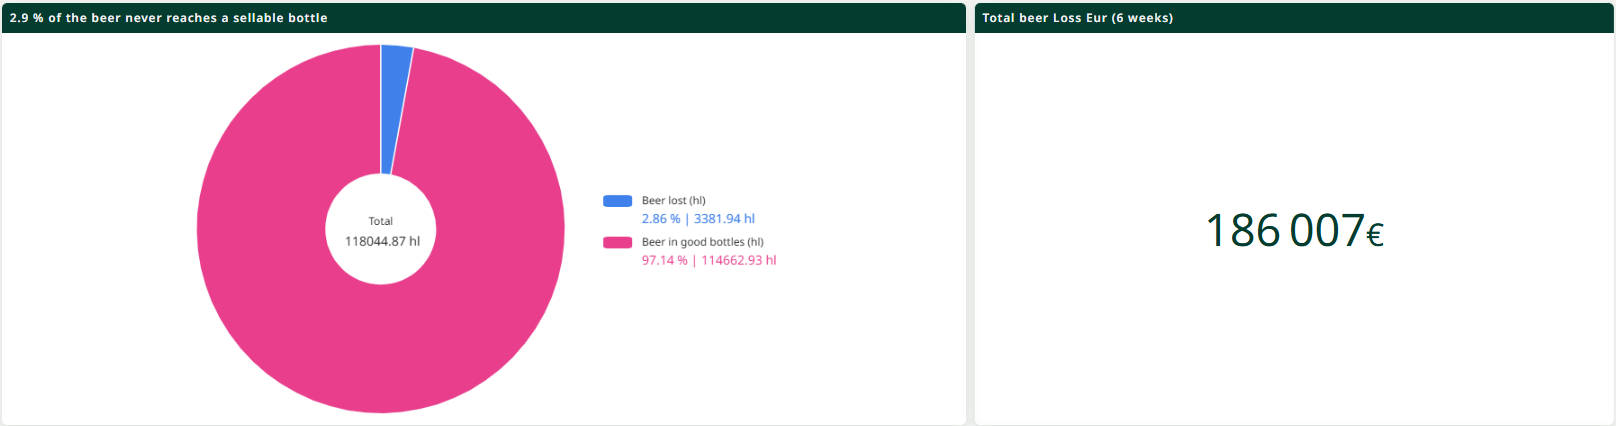
Over six weeks, 118,045 hl of beer were sent to filling. The data comes from Indao’s demonstration dataset, and the analyses presented here come from the corresponding dashboard. The scale of the losses and the underlying mechanisms reflect what is observed in practice.
Over those six weeks, 3,382 hl never reached a saleable bottle, representing 2.86% of the volume.
Using the production cost entered by the brewery in the dashboard - around €55/hl in this scenario - the loss amounts to €186,000 over six weeks.
This is not a benchmark: each brewery values its beer at its own production cost.
Why bottling losses escape day-to-day management
Three factors explain why losses of this scale can remain invisible in daily operations.
Overfilling goes unnoticed
Each bottle that meets specifications contains a few extra millilitres. No reject flags it, and no report tracks it.
Yet 1 ml in a 330 ml bottle represents 0.3% of the packaged volume. On a line running at 30,000 bottles per hour, every extra millilitre per bottle represents 30 litres of beer per hour.
Over a year, that is no longer a minor detail.
Losses are spread across different areas
Tank bottoms, purges, rejects, breakage and overfilling each fall within a different team’s remit.
Beer losses therefore get reported as a single overall figure. No one owns the issue, and no action follows.
Causes interact
Beer that is too warm or contains too much CO₂ foams during filling.
A micro-stop at the labeller or packer leaves bottles waiting: they foam, or remain stuck in the hot zones of the pasteuriser.
A filling valve that wears gradually drifts without triggering a reject.
None of these causes can be seen in a single system. The data needs to be brought together to reveal them.
Where the beer goes: losses broken down by line
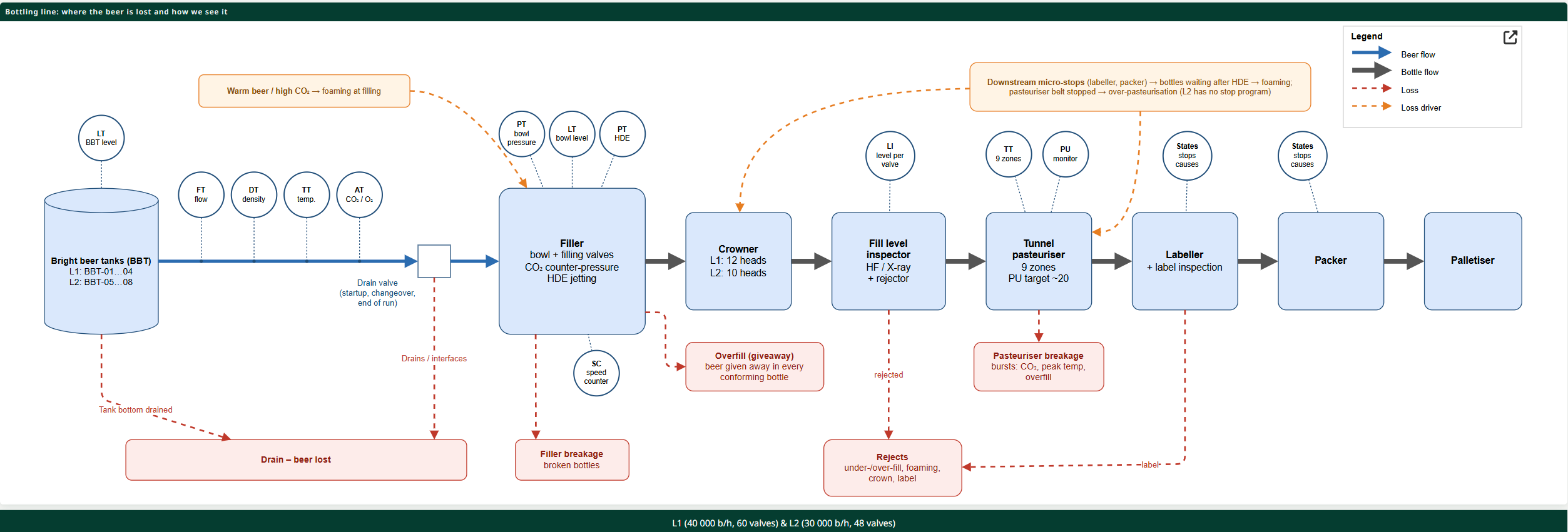
The breakdown relies on sensors most lines already have: measurements at the BBT outlet, filler bowl pressure, the fill-level inspector, pasteuriser temperatures and machine states.
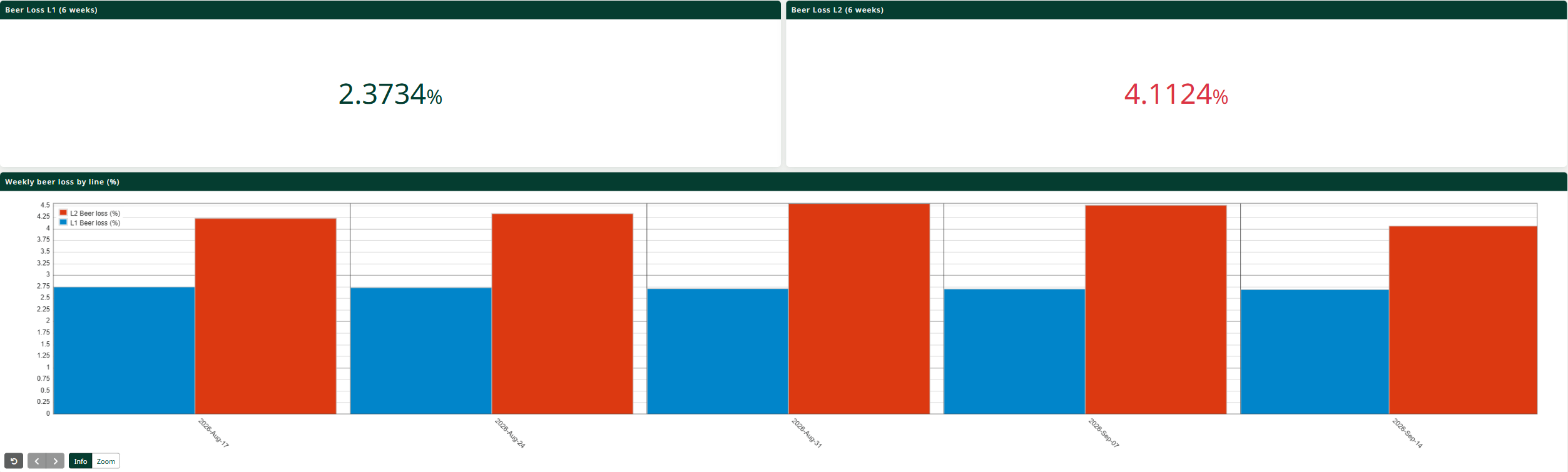
The first finding is that two lines in the same brewery do not lose the same amount of beer.
Over six weeks, L1 loses 2.37% of its volume, or 2,010 hl. L2 loses 4.11%, or 1,372 hl: a loss rate almost twice as high.
The gap is not down to one bad week. Week after week, L2 sits between 4.1% and 4.5%, while L1 remains well below it.
Such a consistent gap has a cause: a setting, a working practice or a piece of equipment. It can be corrected.
The second finding is that each line loses beer for different reasons.
Line 1: 2,010 hl lost
-
Overfilling of bottles that meet specifications: 43.7% of total beer losses.
-
BBT bottoms: 28.4%.
-
Purges during start-ups and product changeovers: 15.6%.
-
Rejects due to underfilling, overfilling, foaming, crown or label issues: 10.0%.
-
Breakage at the filler and pasteuriser: 2.3%.
Line 2: 1,372 hl lost
-
BBT bottoms: 35.2% of total beer losses.
-
Overfilling of bottles that meet specifications: 23.8%.
-
Purges during start-ups and product changeovers: 20.3%.
-
Rejects due to underfilling, overfilling, foaming, crown or label issues: 17.2%.
-
Breakage at the filler and pasteuriser: 3.4%.
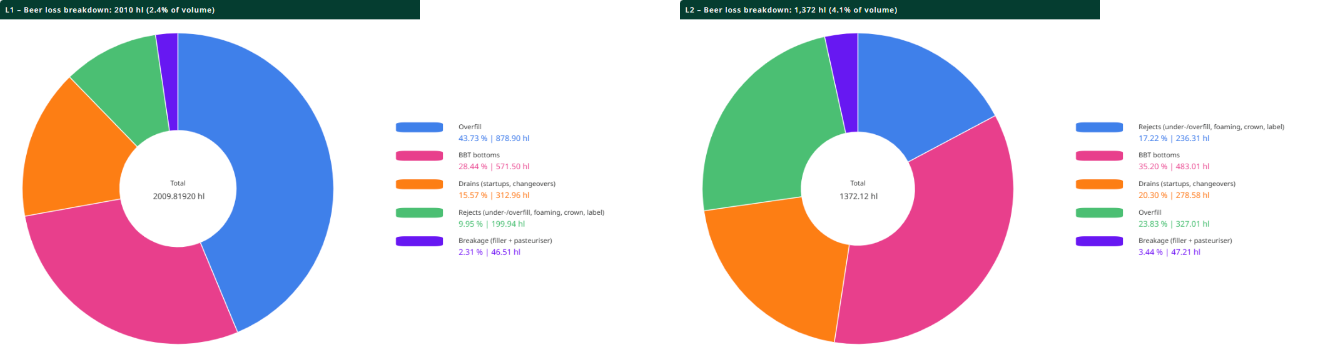
Two lessons emerge.
First, breakage — the loss everyone watches on the line - accounts for only around 2–3% of total beer losses across the two lines.
Together, rejects and breakage, the two categories monitored daily on the line, represent around 12% of losses on L1 and 21% on L2. In other words, the usual indicators cover the smaller part of the problem.
Second, the two lines call for different improvement projects. L1 primarily has a filling accuracy problem. L2 primarily has a tank management and rejects problem.
What the data reveals: specific causes with clear ownership
Three valves drifting week after week
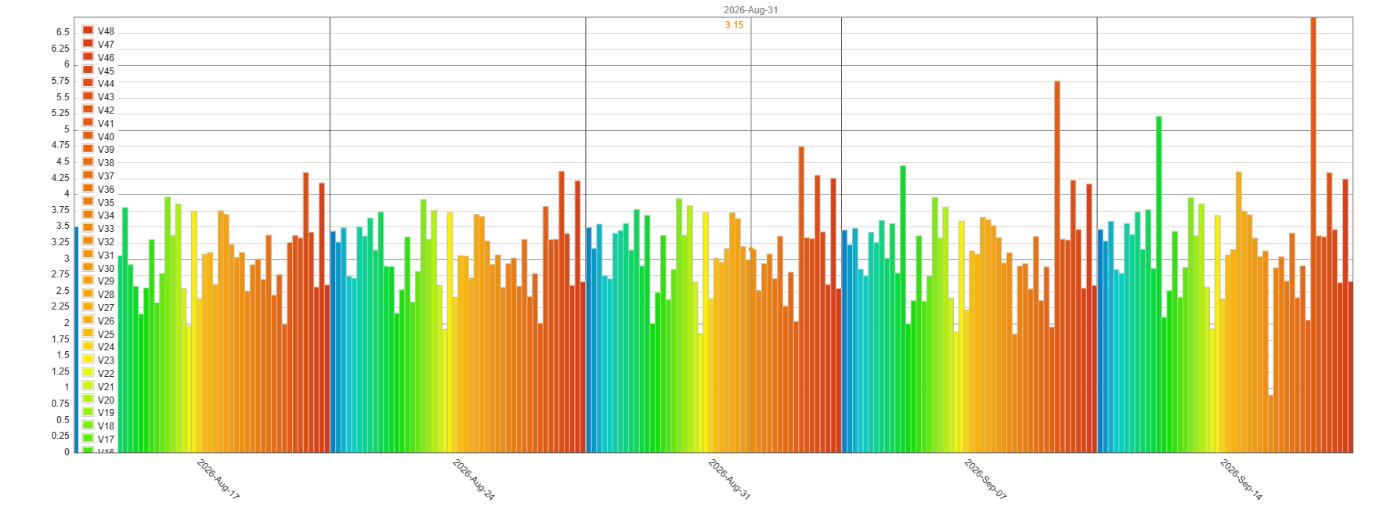
On L2’s filler, overfilling is tracked valve by valve, week by week.
Over five weeks, from 17 August to 14 September, most of the 48 valves remain stable, at approximately 1.8–4.4 ml of overfill per bottle.
Three valves, however, increase every week:
-
V41 rises from 3.3 to 6.7 ml.
-
V12 rises from 2.6 to 5.2 ml.
-
V27 rises from 2.6 to 4.4 ml.
A valve that gains around one millilitre a week is wearing or moving out of adjustment: every bottle it fills contains a little more beer.
V33 drifts in the opposite direction, from 2.5 to 0.9 ml. It is moving closer to underfilling, which raises quality and legal metrology concerns.
In both cases, the action is a maintenance work order for an identified valve, weeks before the fill-level inspector rejects a single bottle.
On L1, the finding is different: overfilling per valve is high but stable. A one-off recalibration is sufficient. On L2, where the valves drift, ongoing monitoring is needed.
A start-up purge costs 50% more depending on the crew
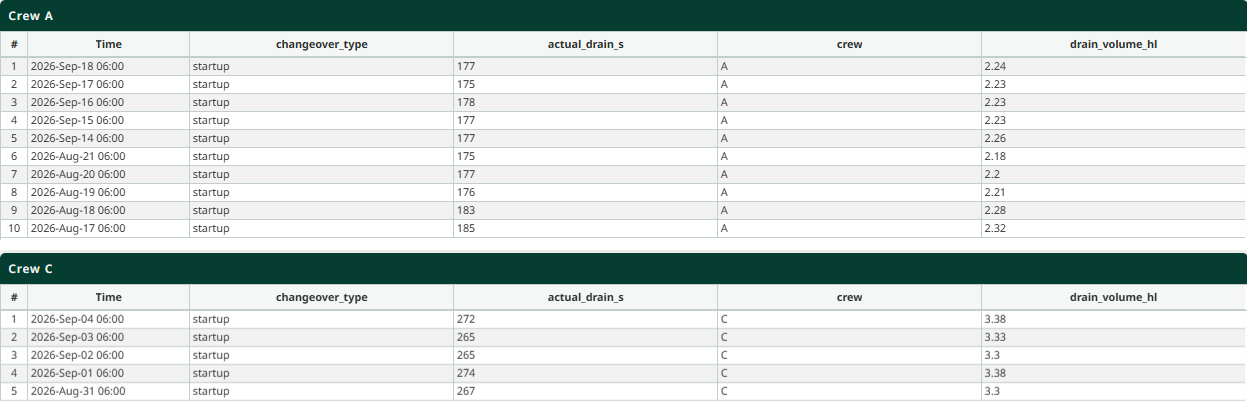
On L2, every start-up begins with a purge from BBT-05 to BBT-08.
Crews A, B and D purge for 175–185 seconds, representing 2.2–2.35 hl per start-up.
Crew C purges for 265–274 seconds, representing 3.30–3.38 hl: around 1.1 hl more at every start-up, using the same tanks and the same line.
This is a difference in procedure rather than an individual failing. The data helps settle the debate about which practice is right.
The correction requires no additional equipment: a common purge duration for all crews, or an automatic purge stop based on the density signal already being measured.
Warm beer causes foaming, and the model sees it coming
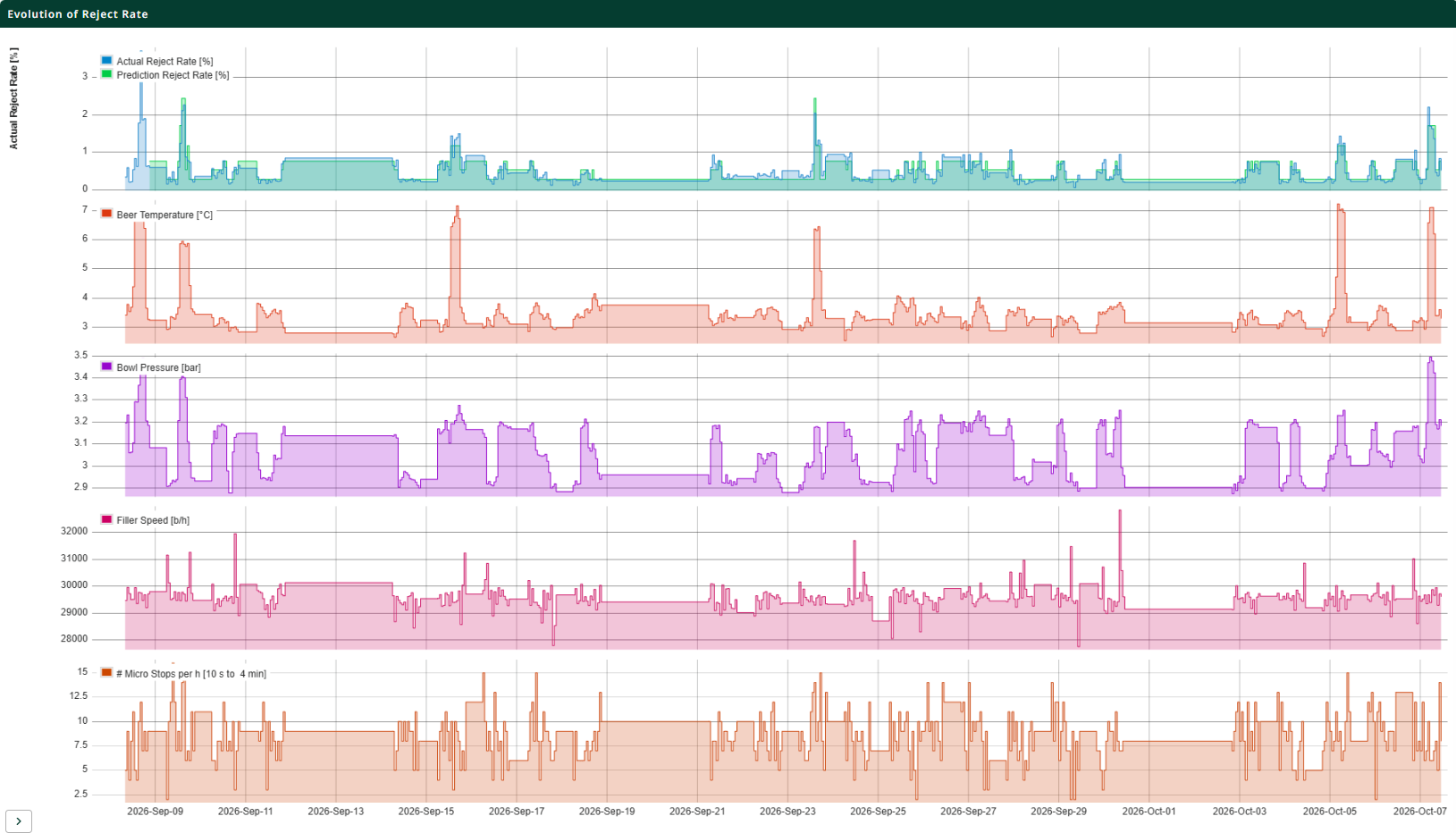
On L2, a model predicts the reject rate from process conditions: beer temperature, filler bowl pressure, speed and micro-stops.
Between 8 September and 7 October, the prediction follows the actual rate almost exactly.
Reject peaks of 2–3%, compared with less than 1% under usual conditions, coincide with beer temperature peaks of 6–7°C rather than around 3°C.
Warm beer foams during filling, and foaming bottles are rejected for underfilling.
If the model tracks actual rejects, the process conditions explain them. The operator can therefore be warned before foaming appears, instead of counting rejects afterwards.
Operating rules rather than a black box
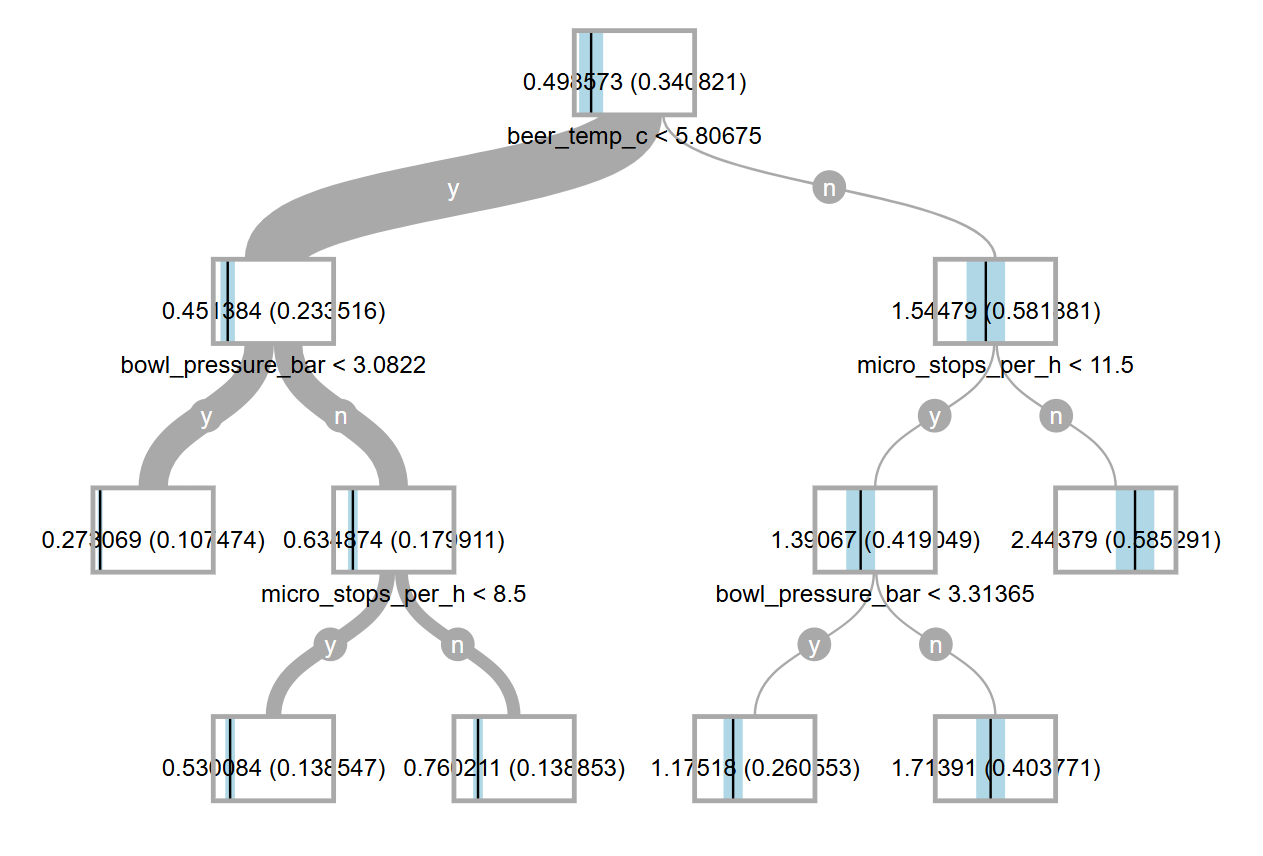
A decision tree applied to the same data turns the prediction into rules.
On average, L2 rejects 0.50% of its bottles. The first factor is beer temperature, with a threshold of 5.8°C. Above that threshold, the reject rate rises to 1.54%, more than three times the rate for cold beer, at 0.45%.
When the beer is warm, the next factor is the number of downstream micro-stops. Above 11.5 micro-stops per hour, rejects reach 2.44%, the worst case.
When the beer is cold, filler bowl pressure matters: below 3.08 bar, the rate falls to 0.27%, the best case and nine times lower than the worst.
These thresholds are specific to the demonstration dataset. At a real site, they are learned from the brewery’s own data.
The underlying logic remains the same: keep beer at filling below a temperature threshold, monitor filler bowl pressure, and treat micro-stops as a quality issue as well as an availability issue.
None of these findings appears in a monthly beer loss report. All emerge when the data is combined with its context: line, valve, tank, crew, machine state and process conditions.
And each points to a concrete action with an identifiable owner.
One loss, one owner, one action
Translated into an action plan, the breakdown assigns each category of loss to an owner within the brewery.
Overfilling - packaging maintenance
Recalibrate drifting valves and raise an alert whenever a valve changes from one week to the next.
Tank bottoms and purges - production
Standardise purge duration across all crews and implement an automatic stop based on density.
Foaming-related rejects - quality and process
Raise an alert when beer temperature at filling exceeds the threshold or when micro-stops accumulate.
Downstream micro-stops - maintenance
Address labeller and packer stops that cause foaming and overpasteurisation.
Breakage
Track it, but do not start there: it accounts for the smallest share.
Most of these actions require no investment in equipment: recalibration, a procedure or alerts.
We are not publishing a percentage reduction here. It depends on each line and must be calculated using its own data.
Two reference points nevertheless show the scale: one millilitre of overfill represents 30 litres per hour at 30,000 bottles per hour, while differences in purge practices account for around 1 hl per start-up between crews.
How to get started: use the data your line already produces
The approach relies on signals most lines already have.
Process
BBT level, beer flow, density, temperature and CO₂, and filler bowl pressure.
Packaging
Fill level by valve from the fill-level inspector, temperatures and pasteurisation units by zone, machine states and stop causes.
Production context
Crew or shift, start-ups and product changeovers, and volumes sent to filling.
In most cases, no investment in instrumentation is needed.
If some signals are missing, a partial breakdown is still possible. Fill level by valve is enough to quantify overfilling, while BBT level combined with the purge valve state is enough to quantify purges.
The first step is to connect one line, reconstruct the loss breakdown using the brewery’s own data, then quantify the actions.
The descriptive breakdown captures most of the value quickly. Reject prediction comes later, once the data is flowing.
One point is worth checking before starting: does the fill-level inspector record the valve number?
Without that information, overfilling can be analysed at line level, but the drift of an individual valve remains invisible.
The most expensive beer is the beer you give away without knowing
Bottling losses are not primarily a breakage or rejects problem.
In this scenario, breakage accounts for only around 2–3% of losses, and rejects for 10–17%. The rest is hidden in bottles that meet specifications, tank bottoms, purges that vary between crews and valves that drift unnoticed.
The data already exists on most lines. What is missing is the connection: reconciling volumes, linking each loss to its cause, line, valve or crew, and valuing it at the brewery’s production cost.
Beer losses then stop being an end-of-month percentage. They become a list of actions, each with a named owner.
Frequently asked questions about bottling losses
What are bottling losses?
They are the volume of finished beer lost between the outlet of the bright beer tanks and the finished pallet: purges, tank bottoms, rejects, breakage, foaming and overfilling. They generally amount to a few percent of the packaged volume.
Do you need additional sensors to measure losses by category?
In most cases, no. Level, flow, density and temperature measurements at the BBT outlet, the fill-level inspector, pasteuriser temperatures and machine states are enough to break down the losses. To track individual valve drift, the fill-level inspector must record the valve number.
Why not simply lower the filling setpoint?
Because the setpoint protects against underfilling, which raises quality and legal metrology concerns.
Lowering it without monitoring the valves risks allowing a valve such as V33 to drift into underfilling.
The right sequence is to identify drifting valves, repair them, then adjust the setpoint with the relevant information in hand. The target fill level remains a quality and regulatory decision for the brewery.
Where should you start?
With one line: connect it, reconstruct the loss breakdown using its own data, then quantify the actions.
What if the brewery has only one line?
The method remains the same. Instead of comparing two lines, compare crews, shifts, products or weeks.
Break down your brewery’s beer losses
You know your end-of-month beer loss figure. Do you know how it breaks down between overfilling, tank bottoms, purges, rejects and breakage?
Connecting a single line is enough to break down your beer losses, link each loss to its cause and an owner, and quantify an action plan.
Contact the Indao team to discuss your brewery.