Invisible Steam Leak in a Brewery: The Case of a 576 kg/h Residual Costing Nearly €190K a Year
A steam trap stuck open cost a brewery €1,100 in a single weekend, no alarm, no visible breakdown. Indao shows how to detect this type of drift using data you already have.
By Valentin Kaulmann, Analytics Project Engineer at Indao, specialized in brewing processes - September 2026.
In an industrial brewery, steam is everywhere. It is used in mashing, boiling, CIP cleaning, pasteurization, certain heating needs, and temperature holding. It supports the major production stages, but also a share of the utilities that keep running in the background.
This omnipresence makes steam management complex. During the week, steam consumption naturally varies with the rhythm of production: batches, cleaning cycles, stoppages, restarts, bottling, load peaks, and overnight lulls. In this context, distinguishing normal consumption from an invisible drift can be difficult.
Yet some losses cause no immediate breakdown, no alarm, and no particular noise. They slip into the site's daily operation and are simply absorbed into the overall consumption profile.
On weekends, when production stops, these drifts sometimes become far more visible.
To illustrate this mechanism, let's take a representative scenario, built from configurations commonly found in breweries. The data and equipment are reconstructed; the orders of magnitude, the physical relationships, and the analysis method, however, correspond to what is observed in the field.
No batch is scheduled between Friday evening and Monday. Yet the steam boiler keeps producing 707.5 kg/h. The expected process demand, estimated by the model from the production history, is only 132 kg/h. The gap, 576 kg/h, stays constant for 51 hours, from Friday 6 PM to Sunday 9 PM.
Result: about 29 tonnes of steam, roughly €1,100 consumed with no associated production, over a single weekend.
This case illustrates a broader issue: breweries don't always lack data. They often lack visibility into what that data actually reveals.
In a Belgian brewing sector facing growing pressure on margins and volumes, this type of drift is no longer a technical detail: it is one of the concrete levers by which operational performance becomes a strategic issue.
Here are three concrete levers to detect, understand, and reduce these invisible steam losses.
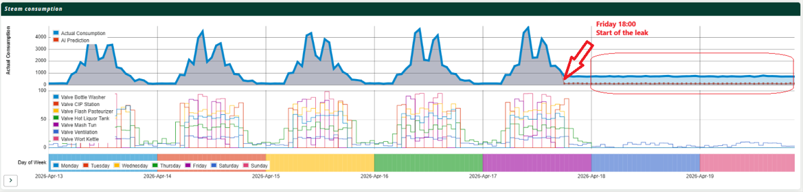
Steam consumption over the observed week: the usual production profile from Monday to Friday, then the leak starting Friday at 6 PM and a constant plateau through Sunday evening.
1. Identify the Baseload Outside Production
The first lever is to look at what happens when the brewery should be consuming very little.
During production, a steam profile is naturally variable. Modulating valves open and close with usage: Mash Tun, Wort Kettle, Flash Pasteurizer, Bottle Washer, CIP station, Hot Liquor Tank, or other process consumers. Consumption peaks are expected, as they correspond to well-identified phases.
On weekends or at night, the picture changes. When the main consumers are stopped, the site should return to a minimal consumption level. This baseline, sometimes called the baseload, becomes a valuable indicator.
In this scenario, the process valves were closed or close to zero. Yet the boiler kept producing a significant steam flow. This means part of the consumption was no longer justified by visible process usage.
This type of gap is difficult to detect during the week, as it is buried in normal production variations. Outside production, it stands out far more clearly.
Analyzing off-peak periods therefore makes it possible to identify:
- steam leaks;
- steam traps stuck open;
- valves that don't close completely;
- equipment left running with no real need;
- abnormal residual consumption;
- energy losses masked during production.
For energy, maintenance, or utilities teams, these periods are particularly useful. They make it possible to distinguish what belongs to the site's normal operation from what corresponds to a persistent drift.
With Indao, this analysis can be automated from existing data. The goal is not just to visualize a consumption curve, but to spot situations where the site's actual behavior no longer matches expected operation.
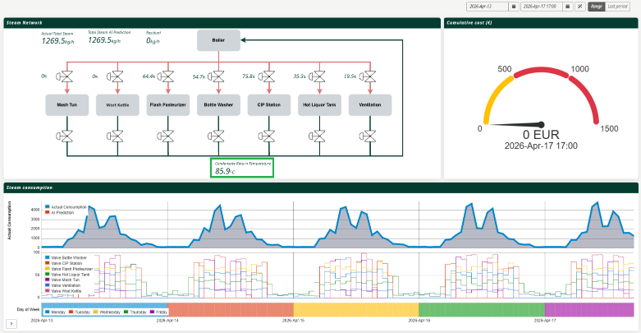
Reference: steam profile of the production week preceding the leak. Actual consumption and prediction aligned, zero residual (0 kg/h) - the expected behavior under normal operation.
2. Link the Steam Produced to Usage Actually Justified by the Process
The second lever consists of not analyzing steam consumption in isolation.
A boiler can produce a lot of steam for good reasons: boiling, cleaning, pasteurization, heating up, or maintaining certain process conditions. Steam flow is therefore only truly interpretable when related to the usage that justifies it.
The data already available on site is enough to understand this relationship:
- steam flow at the boiler outlet;
- modulating valve openings;
- data from supervision (SCADA / historian);
- operating history;
- production profiles;
- weekday, night, and weekend periods.
No additional sensor was needed.
The approach consists of learning the normal relationship between process consumers and steam production. When certain valves are open, a certain level of consumption is expected. When those valves are closed, consumption should drop.
The difference between the steam actually produced and the steam that process usage can justify forms what can be called a residual.
This residual is a very useful signal: it highlights what cannot be physically explained by the brewery's normal operation.
In this scenario, the residual stayed high: 576 kg/h throughout the weekend. The analysis identified the probable cause: a DN40 float steam trap, at the foot of the main header, stuck open - an effective orifice of around 12 mm on a saturated steam network at 10 barg. It is the only common size compatible with such a flow: a DN25 trap, even wide open, would only pass 80 to 180 kg/h.
A second signal, available on the same dashboard, reinforced this diagnosis: the condensate return temperature, stable around 85.9 °C under normal operation, rose to 108.9 °C during the episode. A temperature above 100 °C indicates a return network that is slightly pressurized, consistent with a trap letting live steam through. Taken alone, this signal would not be enough to conclude; combined with the residual, it supports the hypothesis.
This pressurization also has a side effect that is often underestimated: it degrades the discharge capacity of other traps connected to the same return network. An untreated leak can therefore encourage others.
This type of fault is particularly discreet: it does not necessarily trigger an alarm and does not immediately cause a production stoppage. But it consumes, continuously.
This is precisely where advanced analytics add value: they make it possible to go beyond an isolated reading of the data to understand the overall behavior of the system.
Indao helps teams compare the plant's actual behavior with what the process can justify. When this relationship breaks down, the gap becomes visible.
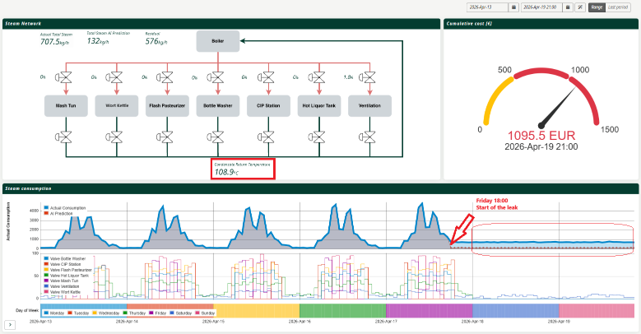
Actual steam (707.5 kg/h), expected steam per the model (132 kg/h), and residual (576 kg/h) - with the condensate return temperature, which rose from 85.9 °C to 108.9 °C, as a converging signal.
3. Quantify the Drift to Turn an Anomaly Into an Action Priority
The third lever consists of translating the technical gap into operational, financial, and environmental impact.
A curve that looks "a bit off" isn't always enough to trigger action. Maintenance and energy teams are constantly weighing several priorities. To decide, they need an order of magnitude.
Valuation Assumptions
Quantifying a steam loss requires explicitly stating its assumptions. Those used here:
- saturated steam network at 10 barg, condensate return at 86 °C;
- net energy to supply: ≈ 0.67 MWh per tonne of steam;
- boiler efficiency (LHV): 90%, i.e. ≈ 0.75 MWh of gas per tonne of steam;
- industrial natural gas cost: ≈ €50/MWh, all-in;
- natural gas emission factor: ≈ 0.20 kg CO₂/kWh;
- e. a steam cost of about €37/tonne.
Depending on the gas price and the plant's actual efficiency, this cost can vary between €34 and €43/t. The figures below should therefore be read as orders of magnitude, not as invoices.
The Impact of the Observed Weekend
The measured gap reached 576 kg/h of steam. Over 51 hours, this represents about 29 tonnes of steam consumed with no associated production, roughly €1,100.
What Really Matters: Detection Time
Taken in isolation, this amount may seem limited on the scale of an industrial site. But the real issue isn't the weekend. A steam trap stuck open doesn't leak only when production stops: it leaks continuously, 24/7. During the week, the loss is simply masked by process noise.

For a single steam trap.
These figures assume a stable, continuous leak at 576 kg/h; in practice, flow can vary with network load. The order of magnitude, however, remains robust.
In a brewery with dozens of traps, headers, valves, and steam consumers, the stakes quickly become significant.
A Useful Clarification
A fair objection: live steam escaping into the condensate return isn't entirely lost, since part of its energy returns to the feedwater tank. That's true - but marginal. Of the 576 kg/h involved, the additional sensible heat recovered represents about 15 kW, against close to 330 kW of latent heat vented at the condensate tank's vent. More than 95% of the energy is genuinely lost.
From Technical Signal to Decision
Quantifying the drift changes how decisions are made. The discussion is no longer about a potential technical anomaly, but about an objectified loss:
- how much does it cost per hour?
- how long has it been going on?
- is it a one-off or recurring?
- which equipment seems to be the cause?
- what would the return on an intervention be?
- should action be taken immediately or scheduled?
This is where the real value of the approach lies. Replacing a steam trap costs a few hundred euros. What's expensive isn't the repair: it's the number of weeks during which no one knew it needed to be done.
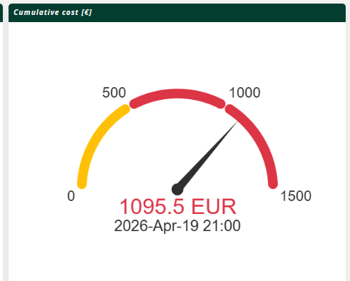
Cumulative cost of the leak: about €1,100 over 51 hours, from Friday 6 PM to Sunday 9 PM.
What the Intervention Confirmed
On Monday morning, the gap appears in the monitoring report. A field check is carried out that day: the header-foot trap is hot on both sides, and the condensate return line shows an abnormally high temperature along its entire length. An ultrasonic sensor check confirms a continuous passage of live steam. The diagnosis is made: eroded seat, trap stuck in the open position.
The costing then enables an informed trade-off. Isolating the main header requires shutting down steam distribution: the intervention is scheduled for the next planned shutdown, nine days later, rather than as an emergency. This delay has a cost - about 124 tonnes of steam, close to €4,600 - but this time it is accepted with full knowledge, weighed against the cost of an unplanned production stoppage.
The replacement is carried out during that shutdown:

The following weekend provides the most telling validation. The residual drops back to between 0 and 20 kg/h, within the model's margin of uncertainty. The condensate return temperature stabilizes at 86.4 °C, returning to its reference level.
Relative to the leak's flow rate, the intervention's payback time is 75 hours - just over three days of operation. And had the drift remained invisible until the next energy audit, eight months later, the cumulative loss would have reached about 3,400 tonnes of steam, close to €125,000.
This is the real lesson of this case: the value does not lie in the repair, whose cost is marginal, but in the delay between the appearance of the drift and the moment someone knows it exists.
From an Invisible Loss to Controlled Performance
Breweries don't only face production challenges. They also need to control their energy consumption, reduce losses, improve operational stability, and limit their environmental impact.
In this context, steam represents a strategic item. An invisible drift can stay under the radar for a long time, especially when it doesn't immediately disrupt production. Yet its cost can become significant when it repeats day after day.
This case shows that it isn't always necessary to add new sensors to better manage performance. The signals often already exist: steam meters, valve openings, supervision data, process history, production profiles.
The real challenge is to link them, put them in context, and turn them into actionable information.
By combining industrial data, domain expertise, and advanced analytics, Indao helps breweries surface these drifts earlier, understand their origin, and translate them into concrete decisions.
FAQ
Do sensors need to be added to detect this type of leak?
No. In this scenario, no additional sensor is needed. The data already available - steam flow, valve openings, supervision history - was enough to build the expected-consumption model and calculate the residual.
What assumptions underlie the loss costing?
A steam cost of about €37/t, corresponding to a 10 barg network, a 90% boiler efficiency, and gas at about €50/MWh. This cost varies from site to site; the figures given are orders of magnitude meant to prioritize action, not to produce an invoice.
Does this method work for utilities other than steam?
The principle - comparing actual consumption to consumption expected from process usage - also applies to compressed air, water, or industrial cooling. Steam is often the starting point, as gaps there are frequent and costly, but the logic remains the same.
How long does it take to identify this type of drift?
In this case, the gap was visible from the first hours of the production stoppage. Once the model is in place, detection is nearly immediate; the timeline mainly depends on how long it takes to connect and structure the available historical data.
Does a single leak like this justify an analytics approach?
Taken in isolation, a one-off leak may seem minor. But a trap stuck open keeps leaking during the week, masked by process noise. It's the accumulation of several such pieces of equipment, over time, that makes the approach worthwhile at the scale of a site.
Learn more
Want to know what your brewery's Sunday curve looks like?
In 30 minutes, it's possible to look at your existing data, identify residual consumption, and check whether certain signals deserve a deeper analysis.
Contact our team to discuss your energy and operational performance challenges.
This case is part of our broader support for brewing processes : brewing, fermentation, energy, quality.
Discover our dedicated approach for breweries.