Intelligent Conveyor Monitoring for Waste Sorting Centers.
Intelligent conveyor monitoring helps waste sorting centers turn fragmented machine data into earlier drift detection, reduced downtime and better maintenance decisions...
In a waste sorting center, a conveyor rarely fails without warning.
Before an unplanned stop occurs, the line often sends weak signals: a motor current slowly drifting, a belt running under unusual load, a subtle increase in friction, a recurring micro-stop, or a mismatch between material flow and energy consumption.
The problem is that these signals are usually hidden inside thousands of data points coming from PLCs, SCADA systems, optical sorters, historians and manual reports. The data already exists. But it is often fragmented, noisy, difficult to interpret and disconnected from day-to-day operational decisions.
For sorting center operators, the challenge is therefore not only to collect more data. It is to turn existing shop-floor data into clear, reliable and actionable indicators that help teams act before a minor drift becomes a critical failure.
Why conveyors deserve closer attention
Conveyors are among the most critical assets in a sorting line.
They connect every key step of the process: feeding, separation, optical sorting, quality control, compaction and storage. When one conveyor stops, the impact is rarely isolated. Material accumulates, downstream equipment is disrupted, operators are mobilized urgently, and overall line availability decreases.
In many plants, conveyor-related issues are still detected too late. Teams often rely on visual checks, manual reporting, generic alarms or post-incident analysis. This makes it difficult to distinguish between normal operational variation and early signs of mechanical degradation.
Typical issues include:
- under-the-belt clogging;
- belt drift or abnormal friction;
- motor overcurrent;
- repeated micro-stops;
- load inconsistencies;
- abnormal energy consumption;
- early mechanical wear;
- equipment behaviour that deviates from historical patterns.
Each of these signals can appear small when viewed in isolation. But when combined and monitored over time, they can reveal a clear operational risk.
The problem is not a lack of data
Modern sorting centres already generate large volumes of operational data.
Conveyor speed, motor current, running hours, equipment status, optical sorter information, flow rates, energy indicators, alarms and production data are often available somewhere in the plant. They may come from SCADA systems, PLCs, historians, optical sorting machines, maintenance tools, ERP systems or manual Excel files.
Yet, in many cases, this data remains difficult to use.
It may be spread across different systems. It may require manual consolidation. It may contain outliers, communication drops, missing values or inconsistent timestamps. It may be available to technical teams, but not transformed into indicators that operators and maintenance teams can use every day.
This is where intelligent monitoring creates value: not by replacing existing systems, but by structuring and interpreting the data they already produce.
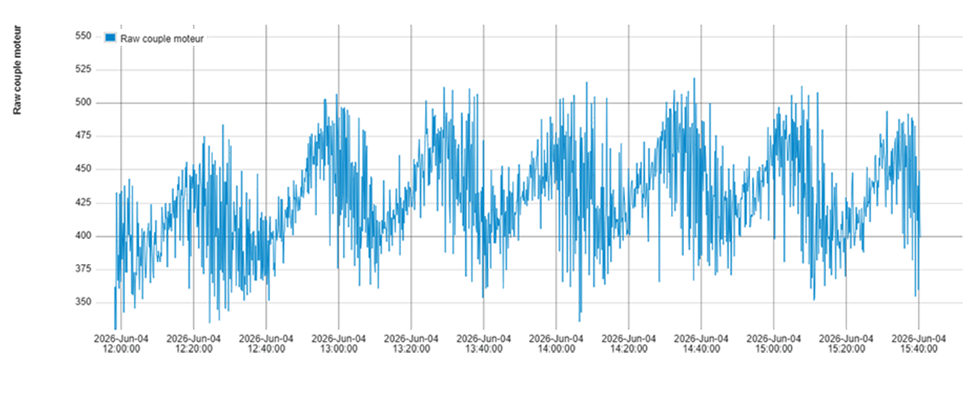
Example of a raw motor signal: data is available, but difficult to interpret without processing, cleaning, and contextualization.
From noisy signals to actionable indicators
Industrial data is rarely clean by default.
On a sorting line, machine signals can be affected by short interruptions, sensor noise, communication issues, irregular material flows or temporary operating conditions. If these raw signals are used without processing, they can create confusion, false alarms or a lack of trust from field teams.
A useful monitoring approach starts by cleaning and contextualizing the data.
This means collecting data directly from existing sources such as SCADA, PLCs and historians, then transforming it into a consistent and usable information stream. Outliers can be filtered. Signals can be resampled. Short-term noise can be separated from meaningful trends. Data from different machines can be aligned and compared.
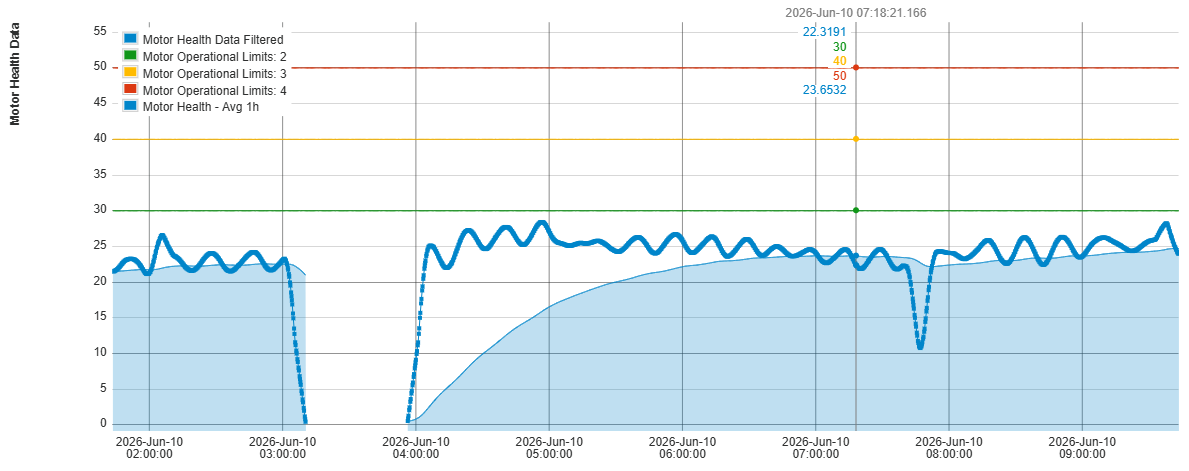
Intelligent monitoring distinguishes short-term noise from meaningful trends and compares actual behavior against reference thresholds.
The objective is simple: help teams see what matters.
Instead of asking operators or engineers to manually interpret raw PLC values, intelligent monitoring highlights abnormal behaviour, equipment drifts and potential risks in a way that is understandable and actionable.
Detecting conveyor anomalies earlier
Once the data is structured, the real value comes from cross-analysis.
A motor current increase may not be meaningful on its own. But if it happens while the material flow is low, or if it deviates from the conveyor’s historical behaviour, it may indicate friction, clogging or mechanical stress.
This is where advanced analytics can support operational teams.
By comparing real-time behaviour with historical baselines, it becomes possible to detect early signs of degradation before standard alarms are triggered. Instead of relying only on fixed manufacturer thresholds, teams can also use data-driven thresholds based on how each specific conveyor normally behaves under real operating conditions.
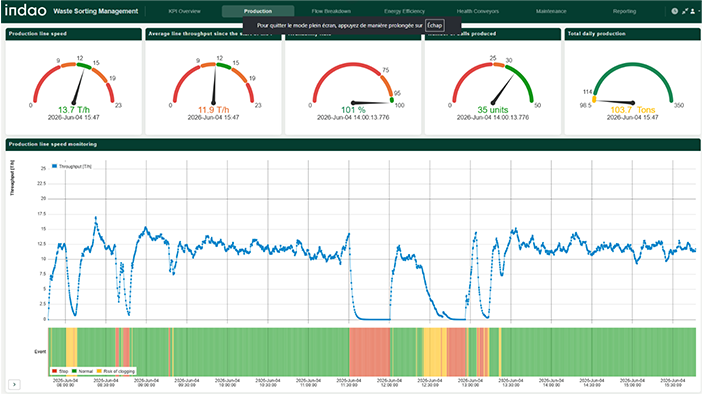
Event visualization helps identify normal periods, clogging risks, and stops on the production line.
This dual approach makes monitoring more relevant.
Manufacturer thresholds remain useful to define absolute safety limits. But historical thresholds help identify subtle deviations that are specific to the asset, the material flow, the operating regime and the plant configuration.
For maintenance teams, this means fewer blind checks and more targeted interventions. For operators, it means greater visibility on line health. For site managers, it means better control over availability, performance and operational risk.
What intelligent conveyor monitoring looks like in practice
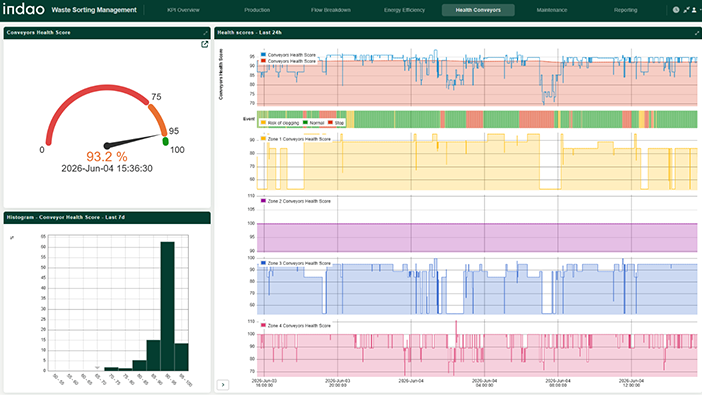
A detailed view helps teams understand how conveyor health evolves over time and investigate risk areas.
A useful monitoring system should not drown teams in technical data.
It should make complex equipment behaviour easy to understand, from the control room to the maintenance workshop.
A practical approach can combine two levels of visibility.
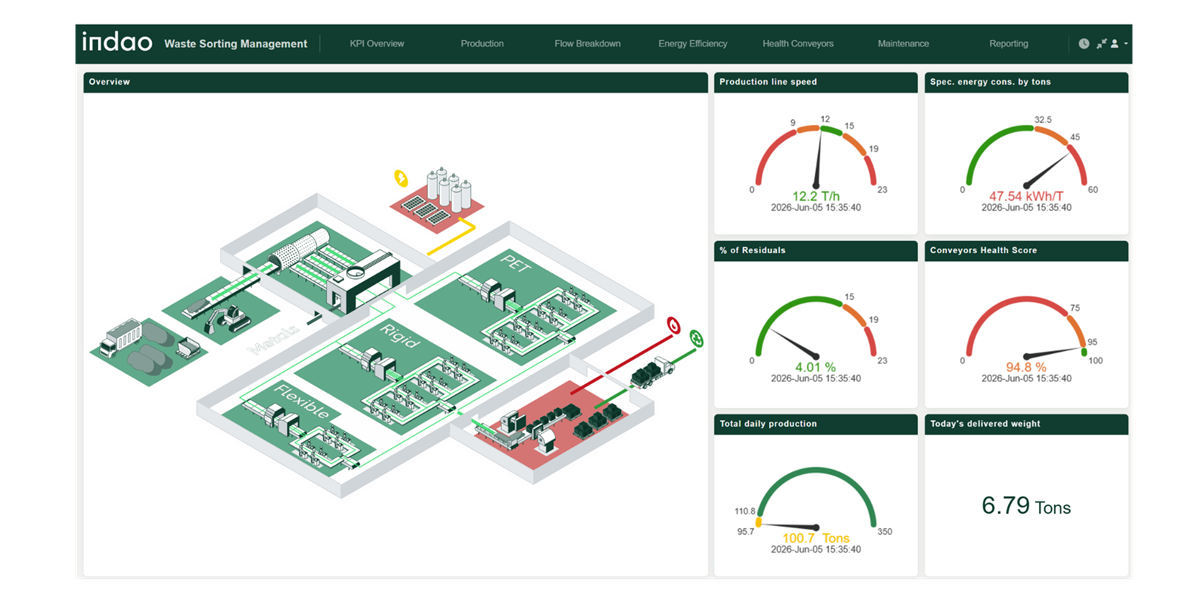
1. A global conveyor health matrix
At fleet level, each conveyor can be displayed in a centralized view with a simple health status.
- Green: the conveyor is operating within normal boundaries.
- Orange: a deviation has been detected and should be checked during the next operational window.
- Red: a critical threshold or abnormal pattern has been detected and requires immediate attention.
This type of overview allows operations and maintenance teams to quickly identify where attention is needed. It also helps prioritize actions across the full conveyor network instead of reacting only to the latest alarm.
2. An asset-by-asset engineering view
When a specific conveyor shows abnormal behaviour, teams need to understand why.
A detailed asset view can show motor current, speed, energy indicators, running hours, alarms and operating trends. Raw data can be displayed alongside cleaned and averaged trends, making it easier to separate short-term noise from real mechanical stress.
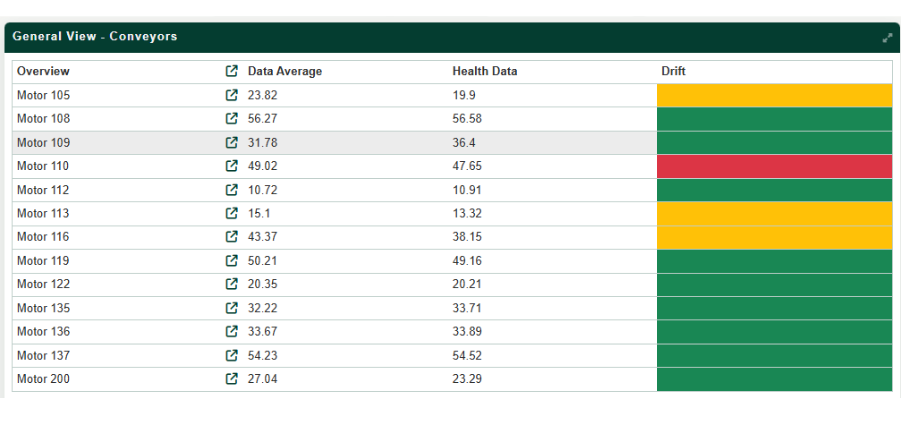
A health matrix allows teams to quickly prioritize the conveyors that need attention based on their level of drift.
This detailed view helps answer practical questions:
- Is this conveyor behaving differently than usual?
- Is the current increase linked to material flow or to mechanical friction?
- Is the deviation temporary or recurring?
- Is the issue becoming worse over time?
- Should maintenance intervene now, during the next shift change, or during the next planned shutdown?
The goal is not to add another dashboard for the sake of visibility. The goal is to help teams make better decisions earlier.
Reducing downtime without adding unnecessary complexity
One of the strongest advantages of this approach is that it does not require replacing existing industrial systems.
In many cases, the necessary data is already available in the plant. The value comes from connecting to existing sources, cleaning the information chain, applying relevant analytics and presenting the results in a way that supports daily operations.
For sorting centres, this can contribute to:
- earlier detection of conveyor drifts;
- fewer unplanned stops;
- more targeted maintenance interventions;
- reduced manual checks and double encoding;
- better visibility over equipment health;
- improved line availability;
- more reliable reporting;
- better understanding of energy consumption and process performance.
Depending on the site configuration and the maturity of the available data, industrial use cases can aim for significant gains in availability, process stability and energy efficiency.
From monitoring to operational confidence
The real value of intelligent monitoring is not only technical.
It is about helping teams move from reactive firefighting to earlier, more confident decision-making.
When conveyor behaviour becomes visible, measurable and comparable over time, operational teams can better understand what is happening on the line. Maintenance teams can focus their efforts where they matter most. Managers can base decisions on reliable indicators instead of fragmented reports or intuition alone.
For sorting centres, this is increasingly important.
Operational pressure is rising. Quality requirements are becoming stricter. Reporting expectations are growing. Energy costs remain a major concern. And downtime continues to have a direct impact on throughput, profitability and service commitments.
In that context, the ability to transform existing machine data into clear operational decisions is becoming a key lever for performance.
How Indao supports waste sorting operations
Indao helps industrial teams centralize, clean and interpret their operational data so they can detect equipment drifts earlier and make better decisions on the shop floor.
For waste sorting centres, Indao connects to existing systems such as SCADA, PLCs, historians, machine data sources and reporting tools. The platform structures the data, applies advanced analytics and provides dashboards designed for operations, maintenance and management teams.
The objective is not to replace existing tools. It is to make their data more useful, more reliable and more actionable.
With Indao, sorting centres can start with a specific use case, such as conveyor monitoring, and progressively extend the approach to other operational challenges: optical sorter performance, residue rates, energy monitoring, production reporting or preventive maintenance.
Take part in our Waste Treatment survey
As part of our Waste Treatment campaign, we are currently gathering field insights from sorting centres and waste operators.
The objective is to better understand the operational challenges faced by the sector: unplanned downtime, conveyor reliability, optical sorter performance, maintenance prioritization, energy consumption, reporting complexity and data usage.
Share your experience in our short survey and receive the key findings in preview.
Your input will help us build a clearer picture of the sector’s priorities and identify where data-driven monitoring can create the most value for sorting operations.
hare your operational challenges in our 5-minute Waste Treatment survey.

Ready to turn your existing plant data into earlier decisions and lasting performance?
Take part in the survey or contact Indao to discuss how intelligent monitoring can support your waste sorting operations.